
Airthings is a Norwegian tech company that has been manufacturing indoor radon monitoring products since 2008.
Their custom dashboard displays air quality data measured by Airthings devices to end users in a convenient way and allows the company to monitor all its devices around the globe.
- Location: Norway
- Industry: IoT
- www.airthings.com/dashboard

React

Mapbox

Express.js

Node.js

AWS
Canvas
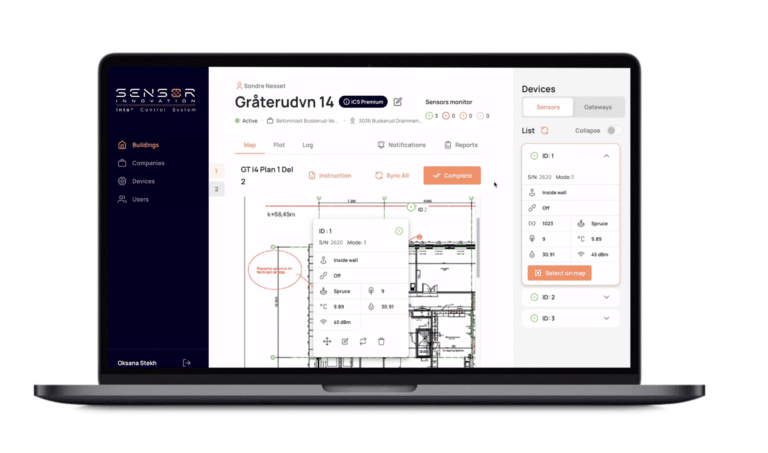
Visualizing air quality sensor data in a web dashboard
Client & product
Challenges
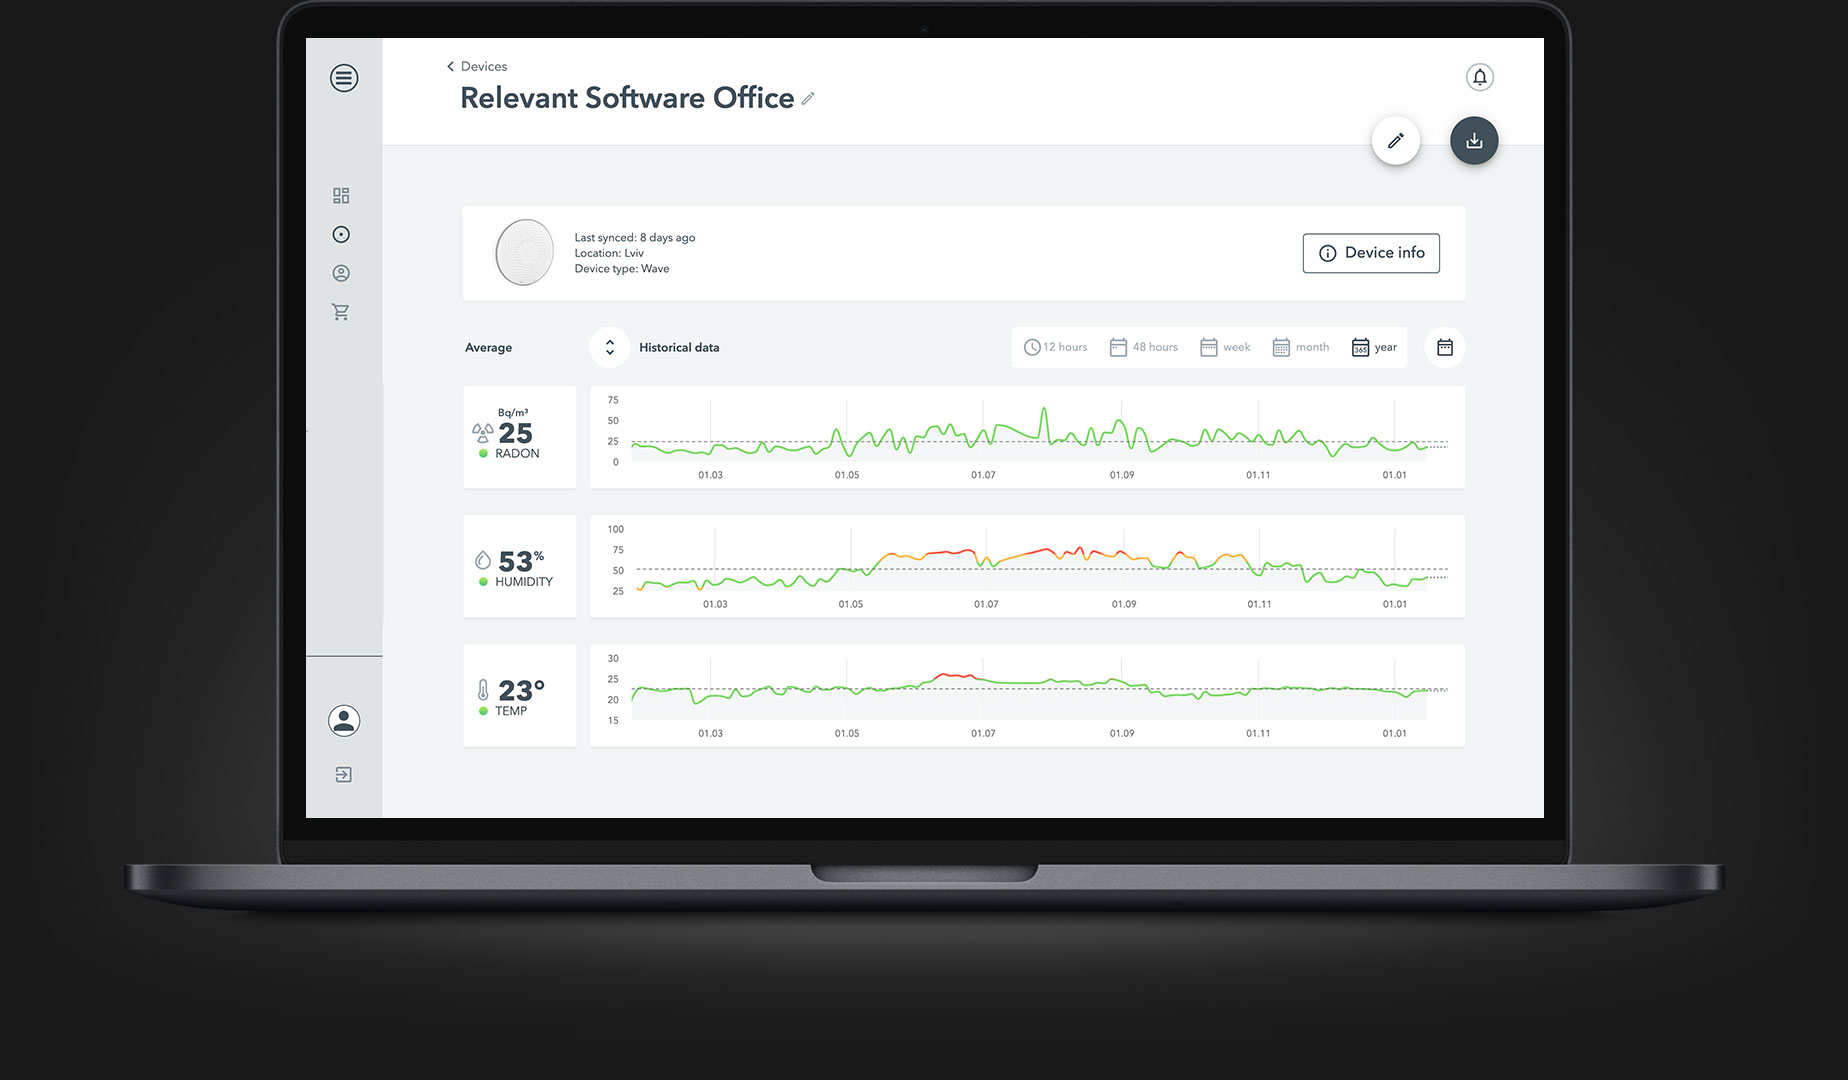
Airthings needed real-time collection, processing, and visualization of data from IoT devices. Data on every Airthings device around the globe must be shown to the device owner in real-time and be available to Airthings managers. With a large number of devices on an interactive map, we had to optimize its performance to avoid lag during transitions.
Job done
Our engineers implemented a new dashboard feature on the Airthings website. It connects all devices and can be customized according to a user’s preferences. In addition, we created a map that shows the location of and data from each device and uses clustering to reduce load times and increase rendering speed.
Implemented features
Monitoring and alert system
Tracks multiple rooms and sends alerts when air quality is poor.
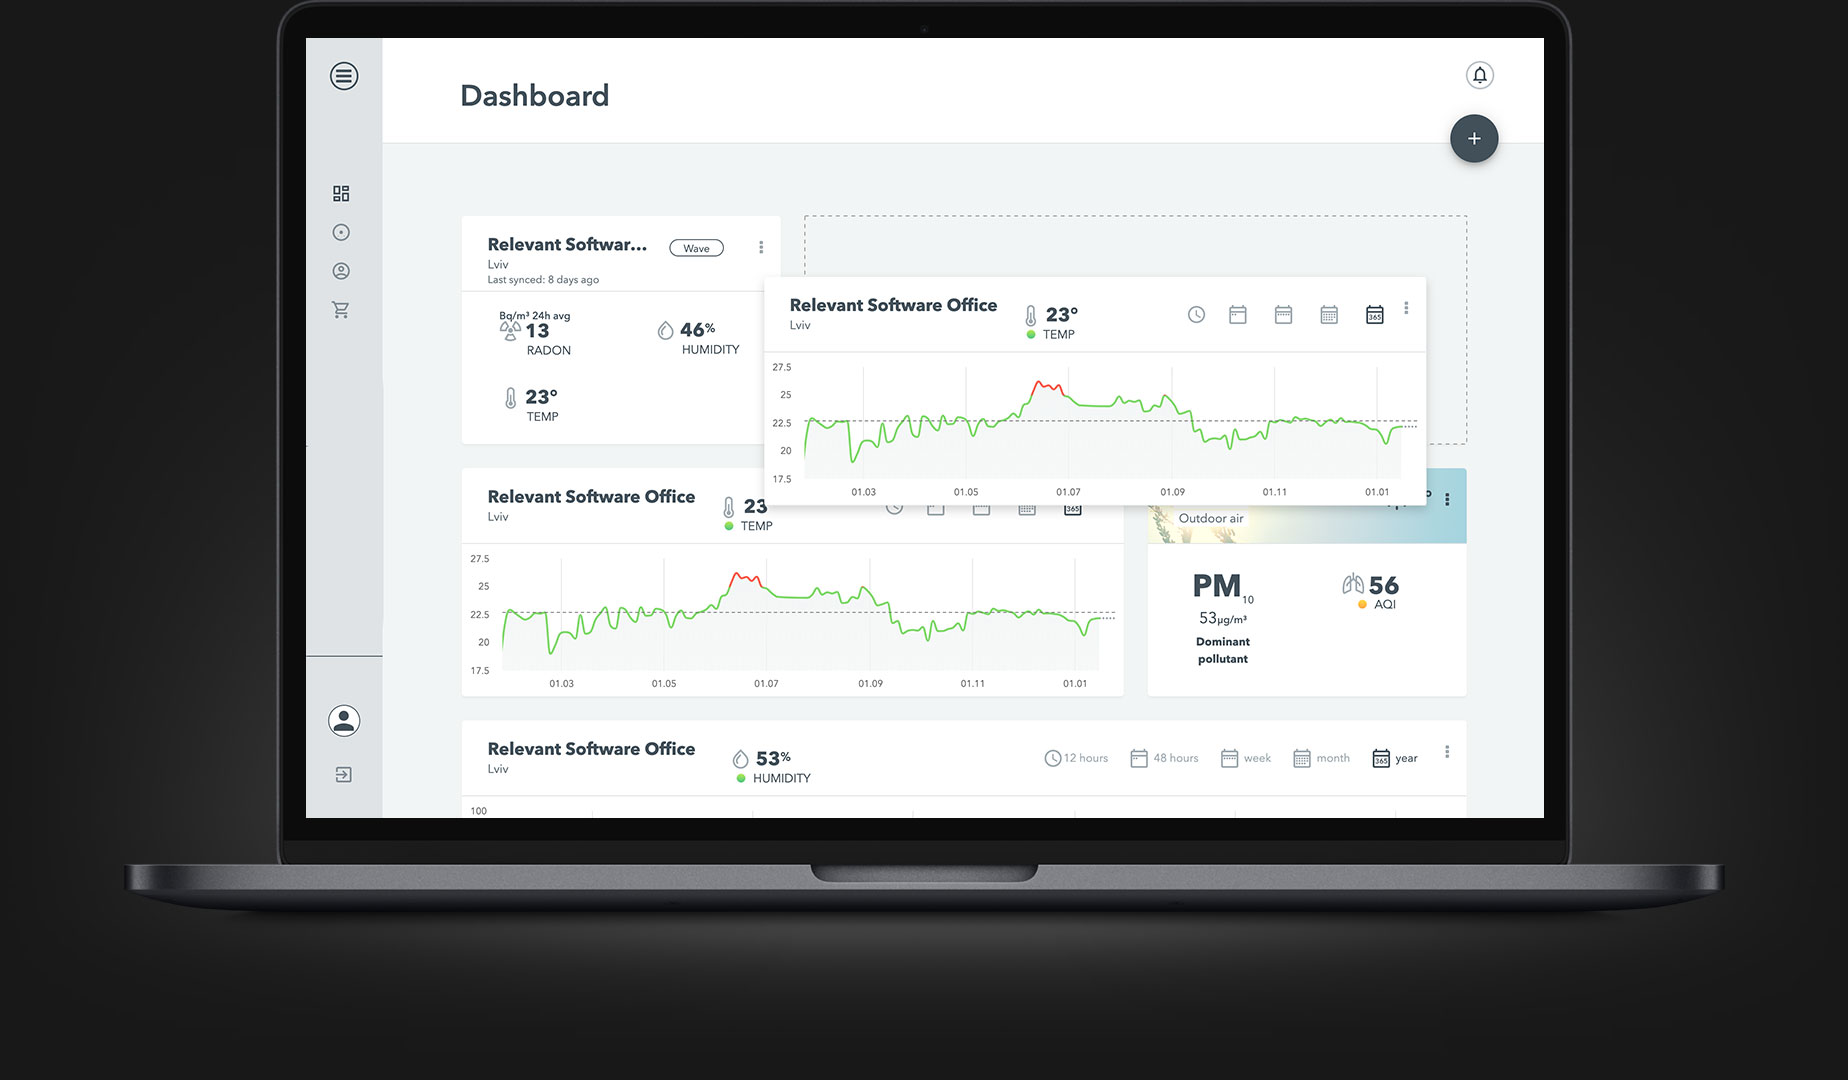
Dashboard customization
Users can add and remove, drag and drop, and resize tiles to fit their preferences.
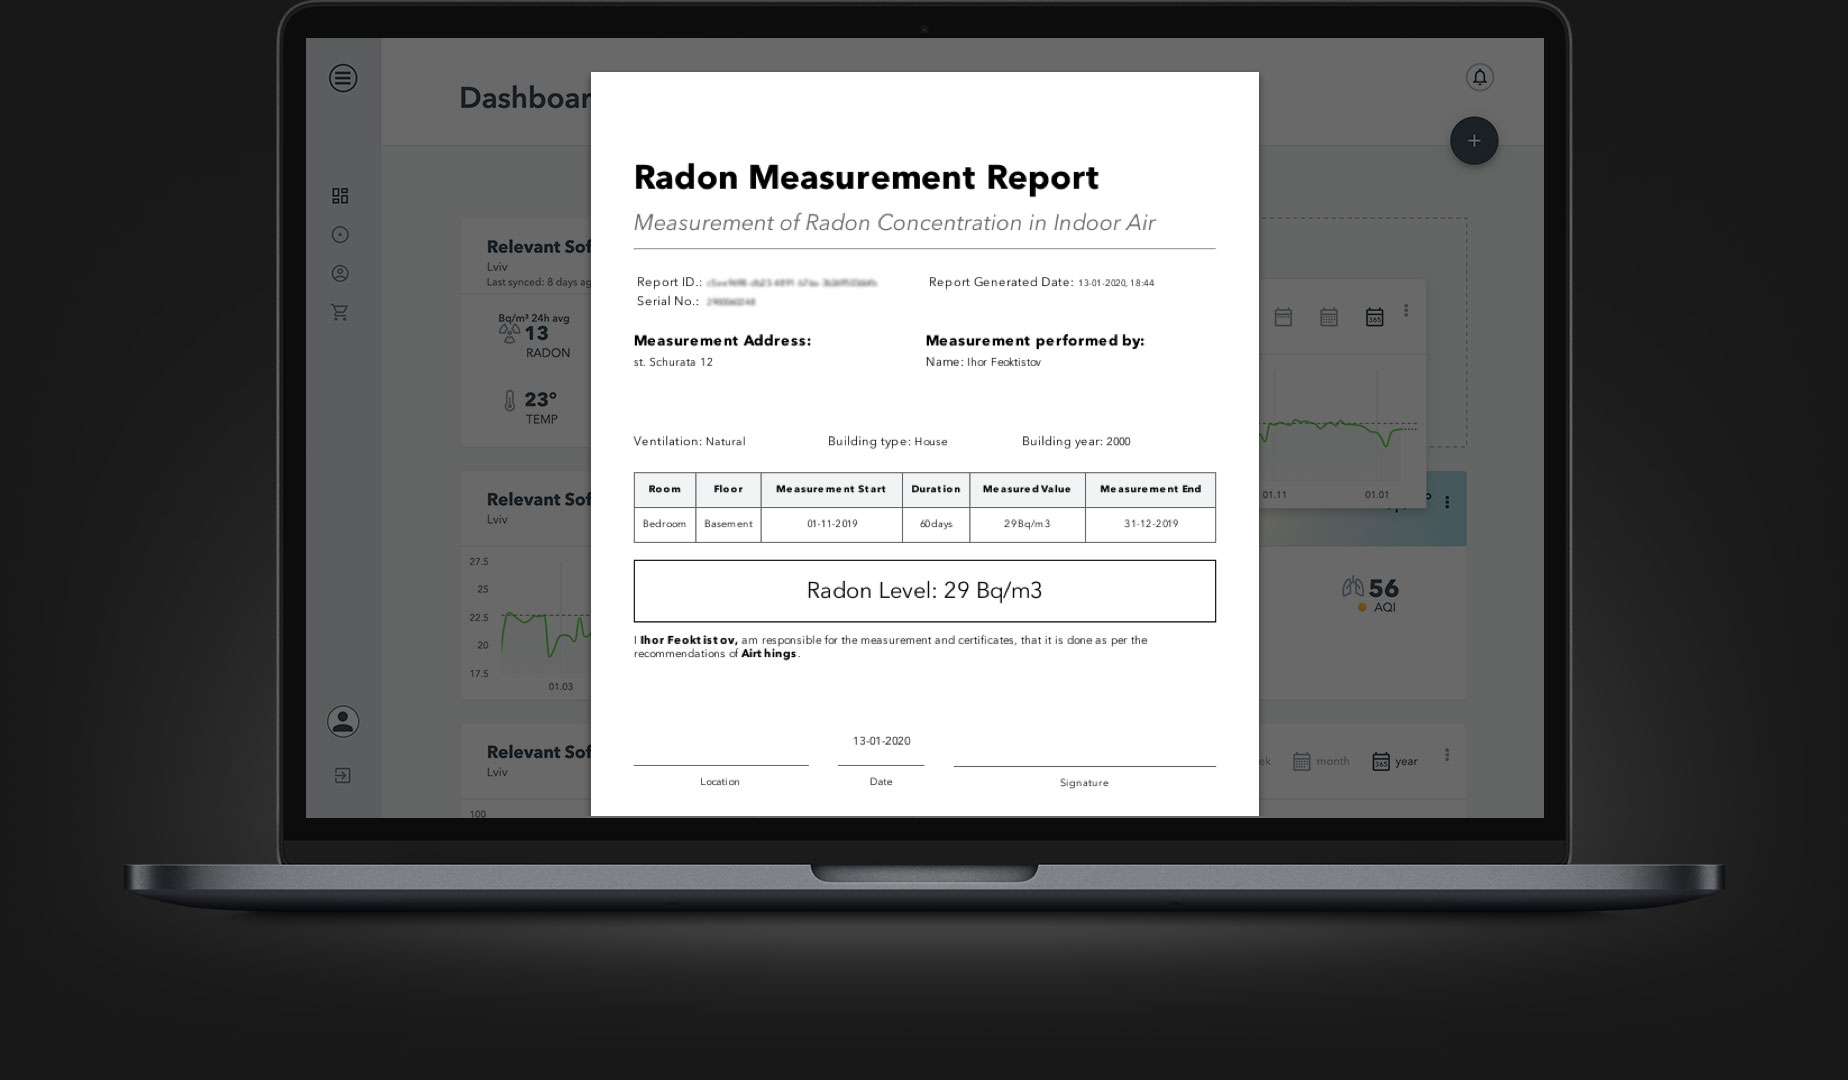
CSV export
Users can download data in a CSV file for further analysis and use.
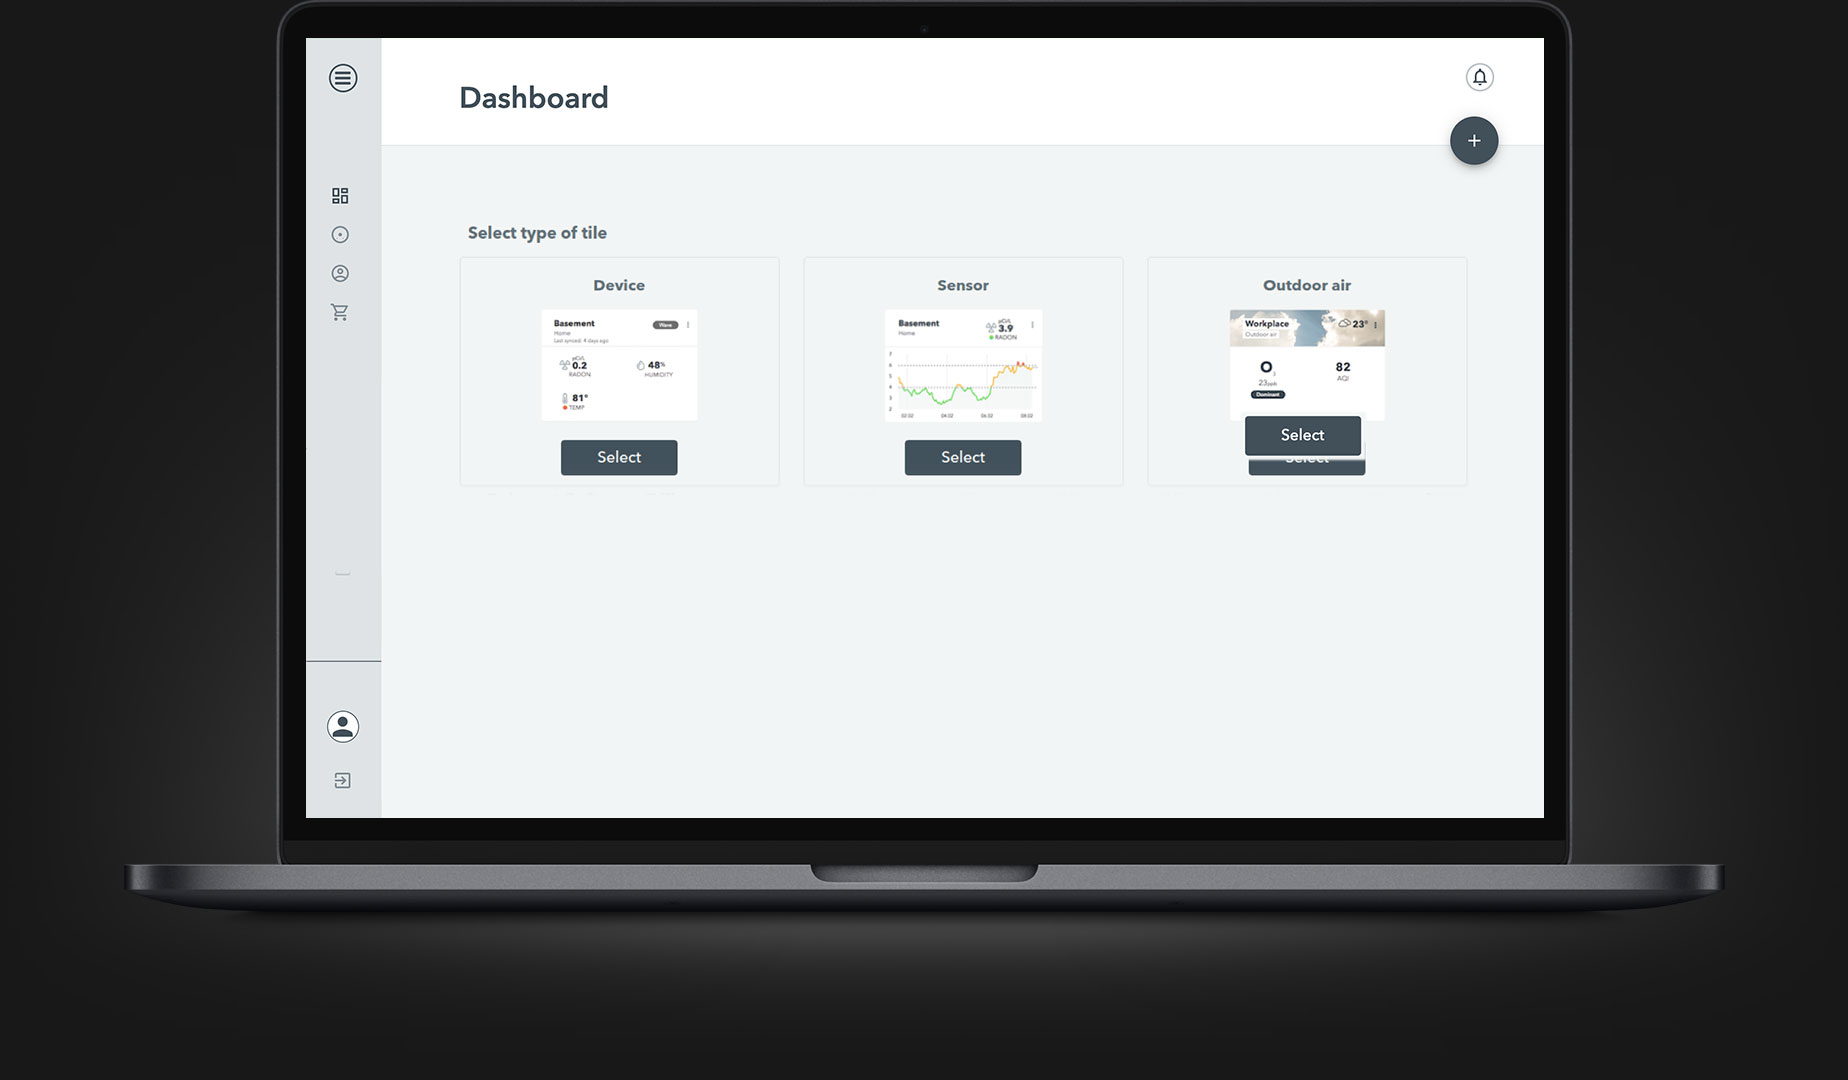
Multiple types of tiles
Device tiles summarize sensor data, and sensor tiles show data from individual sensors.
Map performance optimization
Optimized for fast loading
We configured Mapbox so images displayed on the map are downloaded from multiple domains.
Eliminated lag during transitions
Server-side rendering and Mapbox optimization improved map performance.
Rendering optimization
Raster images speed up map loading and rendering, as they already come from the server ready to use.
Outcomes
The solution, we helped our client develop, opened new opportunities for growth, marketing, and radon level analysis. Now Airthings can:
- attract and engage more users due to the convenience of the dashboard
- monitor the spread of their devices around the globe
- detect potential new markets
In addition, customers are glad to be able to track indoor air quality.
Client’s feedback
Alexander Sagen
Head of Cloud & Web Software at Airthings AS
We used agile methodology and had daily standups. They were great at following up and always made sure we were happy with the team they assigned to us. When we went to visit them before the project started, they were very welcoming and gave us a tour of the city.
They delivered everything they said they would. I'm very happy with them. Relevant Software established a smooth process using agile methodology, while their responsiveness and personable approach contributed to the positive experience.
Top-rated software
development company
development company
200+
projects delivered
remotely
92%
of a team senior
and middle engineers
89%
accuracy of the
estimates
9/10
customer satisfaction
score


Success!
Your copy is on its way! Please, check
your email or download it here now.
Congratulations!
Your contact form has been successfully submitted.
Your contact form has been successfully submitted.

We will review your inquiry and get back to you as soon as possible.
Our team appreciates your interest in our services!
Wait!


Do you know that we helped 200+ companies build web/mobile apps and scale dev teams?
Let's talk about your engineering needs.
Write to us