Building a real-time air quality dashboard for global IoT monitoring
Air quality monitors sold
Over 1,000,000 unitsCommercial and public buildings actively monitored
7,000+Professional users
1,000+THE CHALLENGE
How can a growing network of IoT sensors deliver real-time insights without slowing down the user experience?
Airthings, an award-winning Norwegian company known for its smart indoor air quality monitors, has received global recognition from TIME and CES for making environmental health technology both accessible and innovative. With a rapidly growing user base worldwide, Airthings needed a solution capable of collecting, processing, and displaying live data from a global fleet of IoT devices, without compromising performance.
Every Airthings device streams environmental readings that must appear instantly for end users while remaining accessible to internal teams for monitoring and diagnostics. But as deployments increased, performance issues started to surface, especially on the interactive map, where rendering thousands of data points led to lag and delayed updates.
When Relevant Software came on board, it became clear that the dashboard needed a complete overhaul. To fix these performance problems, we had to create a more flexible interface. Users needed the ability to rearrange panels easily and customise the dashboard according to their priorities. Equally important was the interactive map itself—it required optimization, clustering markers, and introducing server-side rendering to remove delays and speed up loading times.
Alexander SagenHead of Cloud & Web Software at Airthings ASRelevant Software had the right developers ready to go. Their rates were reasonable, and they brought exactly the expertise we needed. A solid choice for anyone outsourcing development.
Have a similar challenge?
We can help!
Book a free consultationTHE SOLUTION
Scalable air quality monitoring platform with smooth global visualization
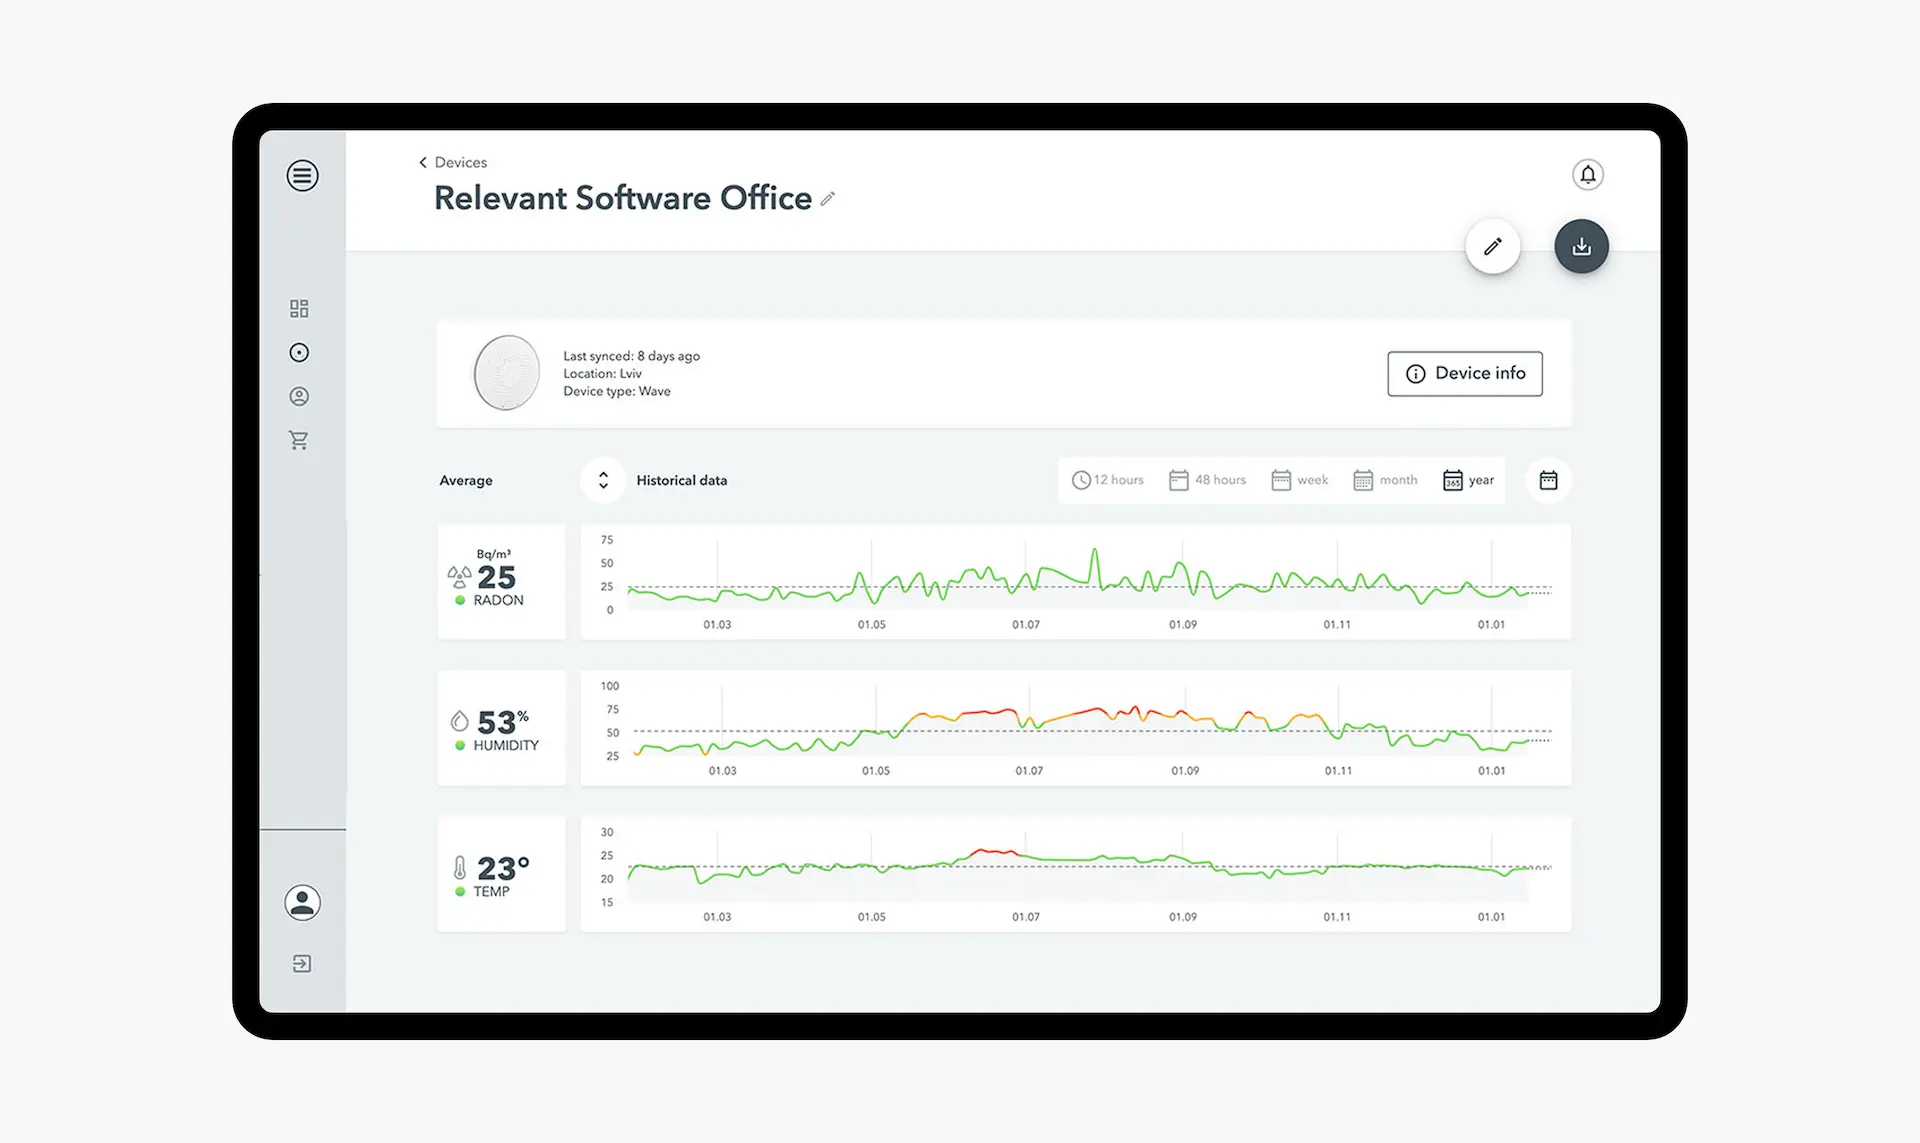
Monitoring and alert system
Our engineering team built a system that monitors air quality across multiple rooms and sends automatic alerts when conditions fall below safe thresholds.

Dashboard customization
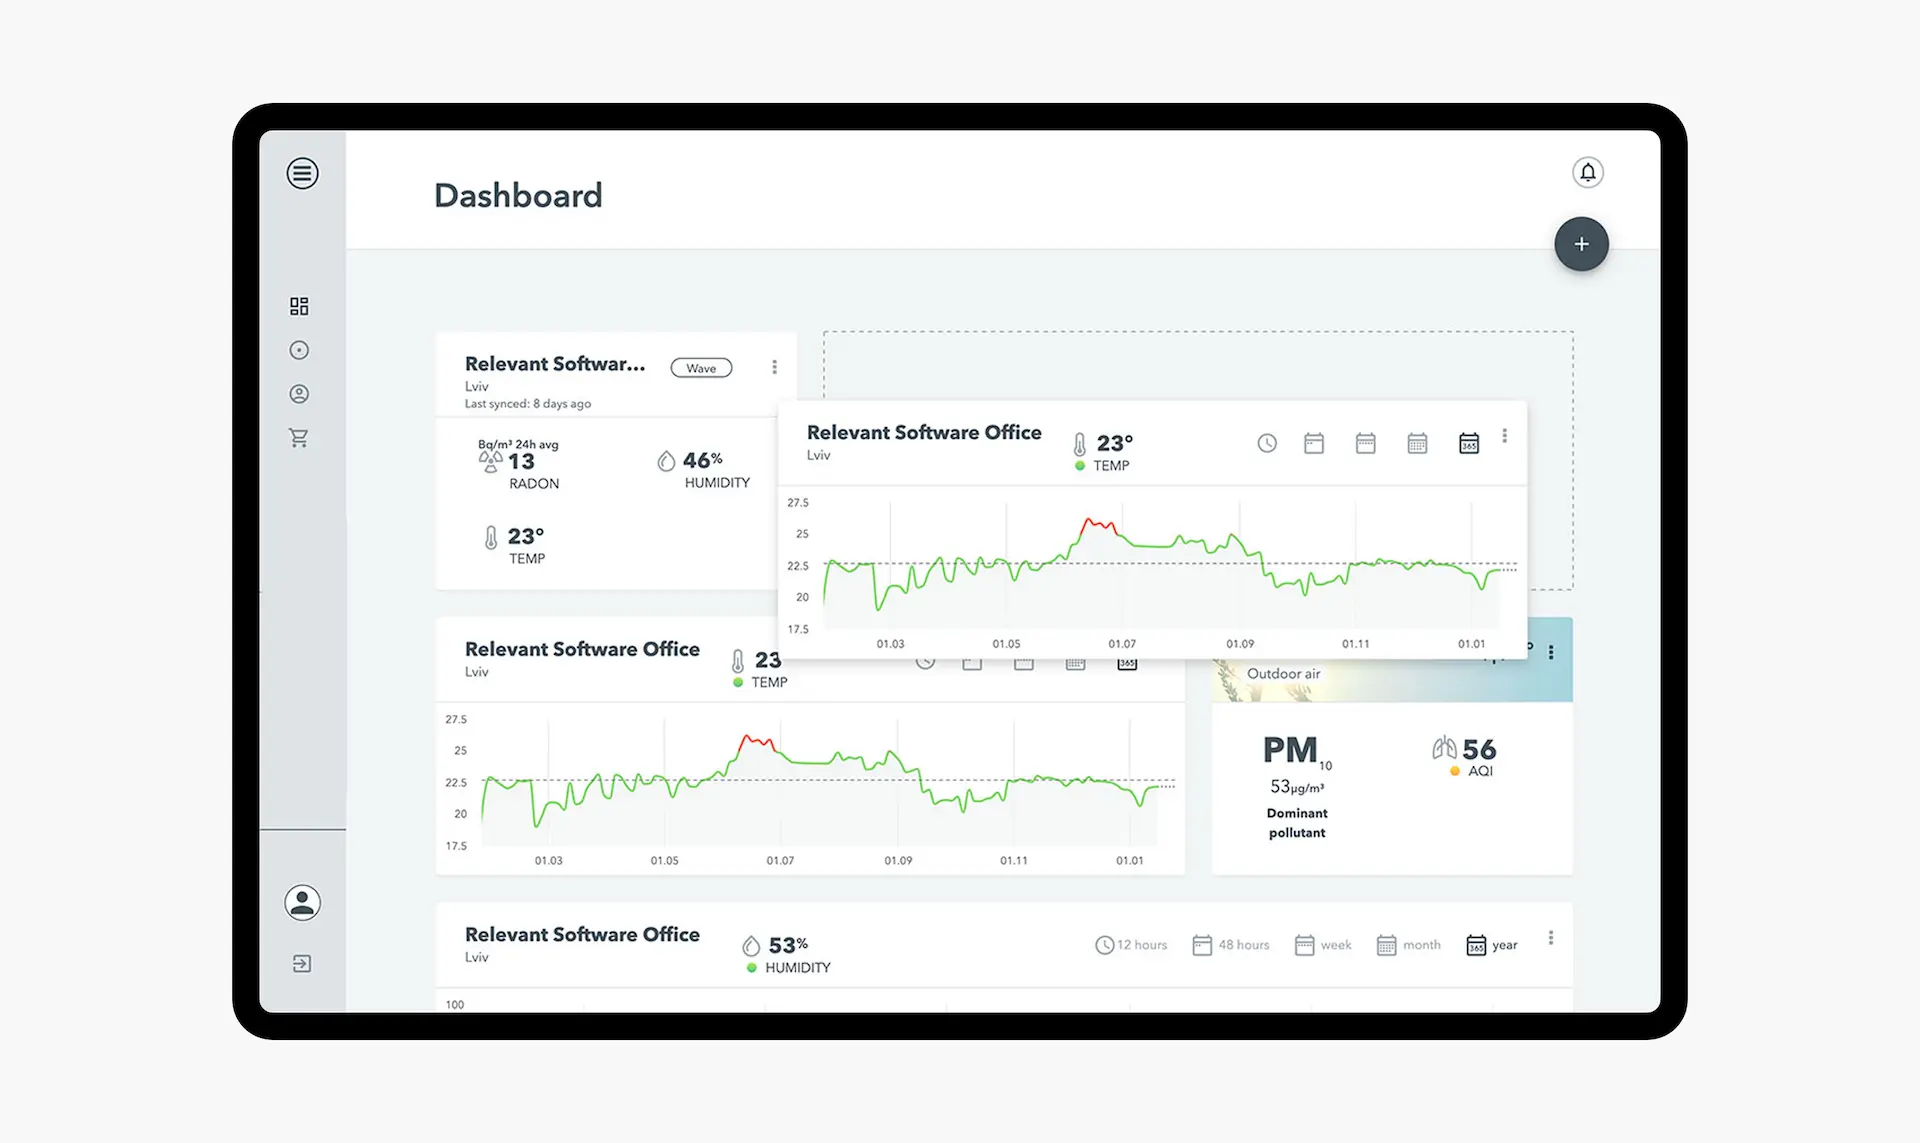
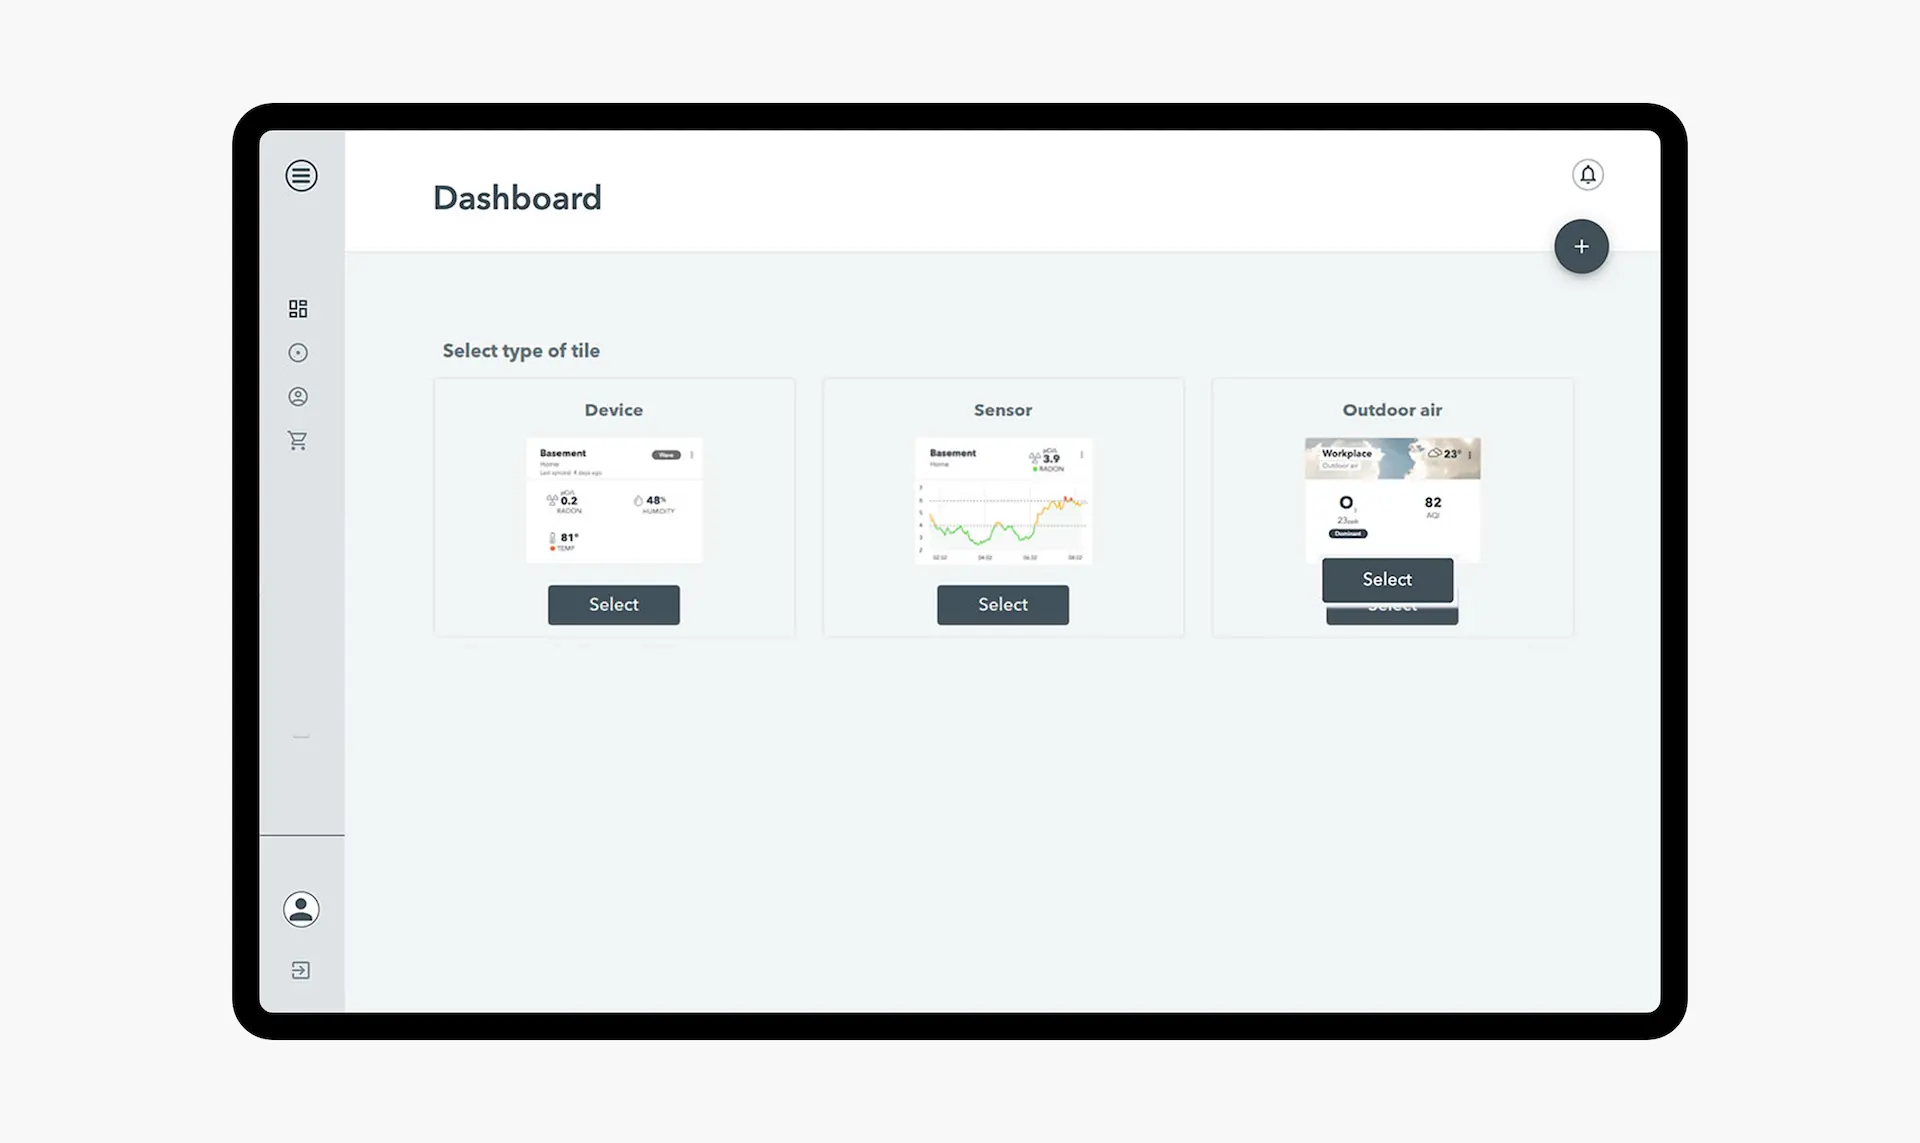
We enabled users to add, remove, drag, and resize data tiles, allowing them to tailor the dashboard layout to their specific needs.

CSV export
Our developers added export functionality that lets users download air quality data in CSV format for deeper analysis and external reporting.

Multiple tile types
We created two types of data tiles: device tiles that display overall summaries, and sensor tiles that show detailed readings from individual sensors.


THE RESULT
100% real-time device visibility
The dashboard displays live sensor data from every Airthings device worldwide, instantly accessible to users and managers alike.
Optimized map performance
We eliminated transition lag and significantly improved rendering speed, delivering a fluid and responsive map experience even at scale.
Actionable environmental insights
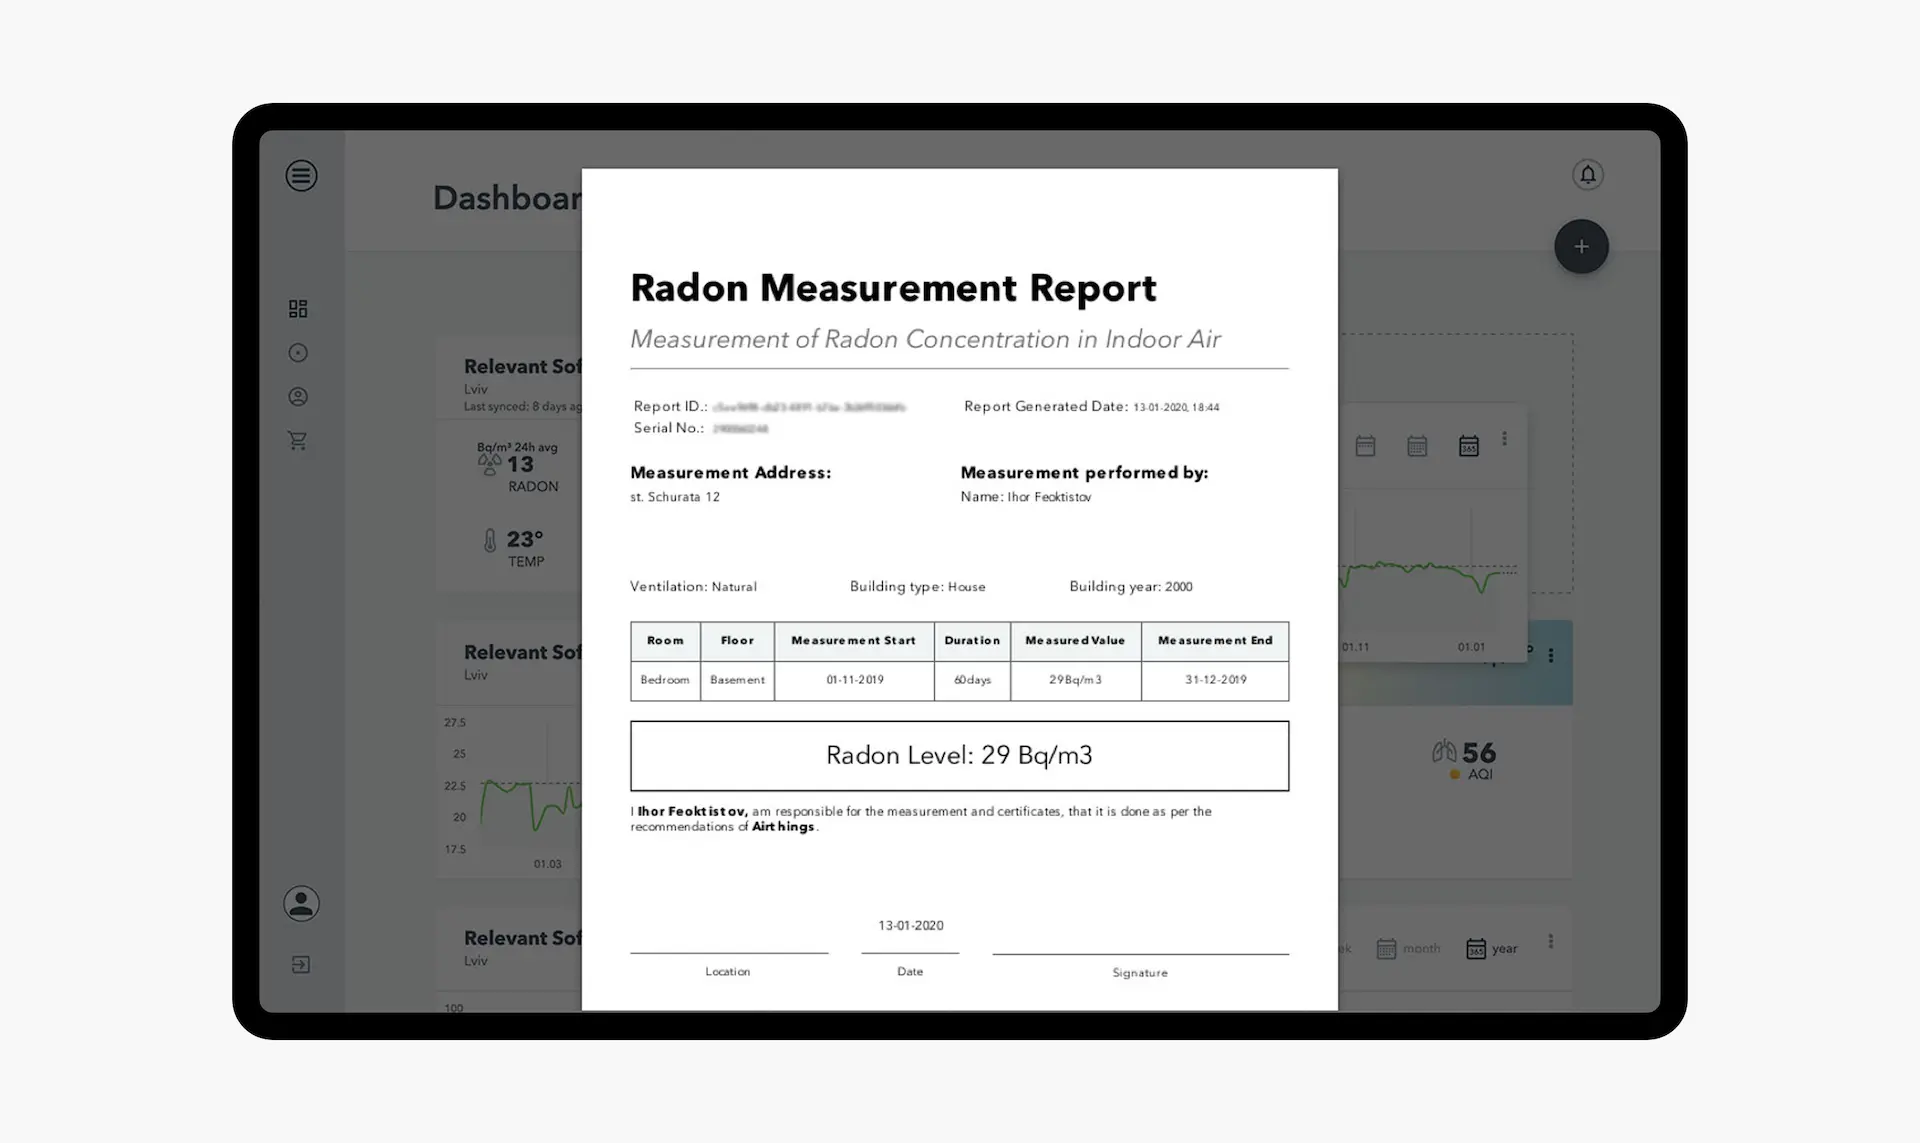
With downloadable reports and intuitive dashboards, Airthings customers can now analyze air quality patterns and make data-driven decisions confidently.
THE CLIENT’S REQUEST
- Visualize IoT sensor data in real time
- Support thousands of devices on an interactive map
- Enable dashboard customization for end users
- Optimize map and rendering performance
- Enable CSV data exports and data exploration
WHAT WE DID
✓ Global air quality dashboard with real-time synchronization
✓ Custom map with clustering and lag-free performance
✓ Personalizable dashboards with drag-and-drop tiles
✓ Data export and alerting for deeper insight
✓ Scalable architecture built for future growth
Alexander SagenHead of Cloud & Web Software at Airthings ASThey delivered everything they said they would. Relevant Software established a smooth process using agile methodology, while their responsiveness and personable approach contributed to the positive experience.
Be our next success story
Share details about your project and book a free call with us
to discuss your development strategy
Success stories across industries
Let’s talk about your project

- Our experts will analyze your requirements and contact you within 24 hours.
- If needed, we’ll sign an NDA to guarantee your privacy.
- You`ll receive a detailed proposal with estimates, timelines, and CVs.
